
When light reaches the eye and is detected by the retina, the image is not processed as a whole, but as the combination of many components. Some neurons (brain cells) in the visual system respond only to borders of a certain direction, for example horizontal lines, they then don’t respond at all to vertical lines. Another aspect of the image that is crucial for the brain to understand what we are looking at is the collection of spatial frequency components. Take for example an image of a forest. First of all there are mostly vertical orientations, so the brain will detect that. The trees together form a pattern similar to a vertical grating. For example, it may look somewhat similar to the grating below:

The closer the lines of the grating are together, the higher the spatial frequency. Cells that respond to spatial frequencies have a preference, they respond enthusiastically when they detect this preferred frequency but are mostly silent when frequencies are much different.
The way the visual system takes apart the image in directions and spatial frequencies can be mimicked by a mathematical method called 2D Fourier transform. The maths behind it are rather difficult, but by visualising it we can get an idea of what happens. Here is the image we’ll take as a starting point:

Immediately you see that there are a lot of horizontal and vertical lines, so that has clearly been picked up by our visual system. If we run a 2D Fourier transform on the image we can plot it like this:

Low frequencies (coarse gratings) are plotted in the middle and high frequencies (fine gratings) towards the outside. You can also read out which orientations are most prominent in the image. In this example you can clearly see a horizontal and vertical line, but not much else. This corresponds with what we had already observed: that the image almost entirely consists of horizontal and vertical elements.
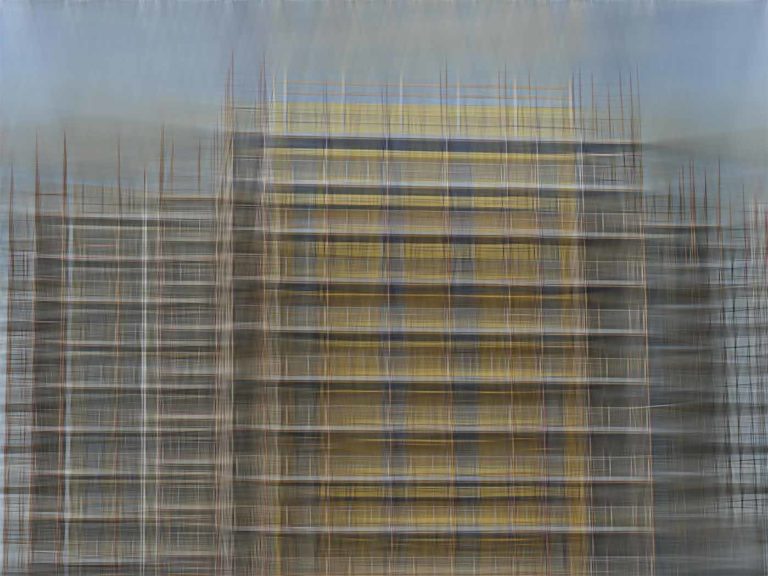
In fact, the information about other orientations are barely useful, a bit of a waste to be honest. The 2D Fourier transform method has a useful trick that we can use. The plot of the 2D Fourier transform can be used to transform back to the original image (not entirely true though, because there is also an imaginary part to this plot that we humans cannot imagine… I know, bonkers. This part is expressed in imaginary number and is actually really important for interpreting the image once it’s transformed back. It encodes the phase shift of the frequencies, whereas the real part provides information about the frequencies and their amplitude). Before doing this, however, we’ll discard some useless stuff, let’s say we’ll only keep the horizontal and vertical bits plus and minus 10 degrees. The resulting 2D Fourier transform looks like this:

The last step is to transform this back to an image:
We are still perfectly capable to understand the image with just a small portion of the information. Here are the horizontal and vertical components separately:
